In 1830, a rapidly growing settlement on the banks of the Mississippi River shipped more cotton than any other port in the region and was described as "the great steamboat depot of West Tennessee." It wasn't Memphis.
Like planets, cities have a gravitational pull. As a city grows, its gravity becomes stronger and it attracts people and economic activity. The more it attracts, the larger it grows. The larger it grows, the more it attracts.
A metropolitan statistical area (MSA) is the region that has fallen under the gravitational influence of the core city. The Memphis MSA spans nine counties in Tennessee, Arkansas, and Mississippi; these counties contain dozens of small, independent towns and municipalities, but their futures and fortunes are inextricably tied to Memphis.
After a city achieves a certain mass, it seems inevitable that it will become the core of an MSA. But before then, that role is up for grabs. Was it inevitable that, of all the settlements in the area, Memphis would be the one to achieve critical mass? Why is a town like Randolph, Tennessee, in the Memphis metropolitan area, rather than Memphis being in the Randolph metropolitan area? The answer is not so obvious.
A good place to start is geography. Did geography alone make Memphis the best candidate to become the dominant commercial center in the region? No. Imagine it's 1830, and you're given the task of choosing where in the Mid-South to place a city. Before the urban geography was settled, the dominant industry was agriculture, so the most promising location would be one with favorable conditions for trading, warehousing, and shipping agricultural commodities. You would eliminate the cities without access to the Mississippi River. The river is/was prone to changing courses, so of the cities on the Mississippi, you would eliminate the ones not located on a deepwater channel where the river's course is fixed. Finally, the river is extremely prone to flooding, which makes storing commodities risky, so you eliminate the cities not on high ground. Memphis, high above a deepwater channel in the Mississippi on the Fourth Chickasaw Bluff, is still in the running. But Memphis is not unique in its geographic advantages.
You might consider planting your city near Randolph, Tennessee. Similar to Memphis, Randolph has a flood-safe location on the Second Chickasaw Bluff above the Mississippi River. The river runs deep at Randolph, which made it unlikely to change course. Randolph even had a slight edge: the city sat at the confluence of the Mississippi and a tributary, the Hatchie, navigable 70 miles inland. Memphis' tributary, the Wolf, was only navigable 10 miles inland.
An observer in 1830 might bet on Randolph. Not only did the city have similar, perhaps better, geographical advantages, but Memphis was crippled by repeated disease outbreaks. In 1830, Memphis had a population of 663. Randolph had a population of about 1,000. Randolph was a more important shipping center than Memphis and shipped more cotton.
But we know how this story ends. So what saved Memphis?
The Post Office. In 1829, near the peak of Randolph's commercial success, the postal service delivered a crippling blow to the fledgling regional capital: the main postal route was placed through Memphis, the sickly city to the South, rather than Randolph. The route connected Memphis and Nashville and brought mail thrice weekly. Randolph, with its once weekly delivery, instantly became more remote than Memphis. Mail, the only facilitator of long distance communication and economic transactions, was the lifeblood of the early 1800s economy, and the improvement in infrastructure that accompanied the development of the postal route drove people and activity through the city. Railroads soon followed. Memphis' gravity grew stronger, and was soon strong enough to attract economic activity away from Randolph. Randolph fell into Memphis' sphere.
This narrative glosses over a few facts about Randolph's decline. Shortly after the town was founded in 1823, a faulty land title cast doubt over the ownership of the land the town was built on. The promise of a canal connecting the Tennessee and Hatchie rivers never materialized. Attempts to attract a railroad failed. And to put the final nail in Randolph's coffin, federal troops burned the town during the Civil War. Twice.
The land title and the burning of the town were exogenous events that severly damaged Randolph's prospects. But other frequently cited factors in Randolph's decline occurred after the establishment of the postal route and may be symptoms rather than additional causes.
In the first decades of the 19th centuy, the region's burgeoning agricultural economy needed a commercial center, and two cities were at the tipping point. The postal route pushed Memphis to critical mass. Gravity did the rest.

Friday, September 13, 2013
Thursday, September 5, 2013
Solow Act
Is Memphis on a long term path to prosperity?
As of the last Census, Memphis was the poorest large metropolitan area in the county. With Memphis' level of poverty, it will take more than a rising economic tide to lift the fortunes of the Bluff City; we need economic global warming with a subsequent rise in sea levels fueled by melting economic glaciers.
Tides are cyclical, but melting glaciers are a long run trend. And despite not experiencing the uptempo growth of similar sized cities like Austin and Nashville (maybe Memphis put its eggs in the wrong musical basket), Memphis' long run trend is lumpy but positive. But can we say anything more optimistic?
One theory of economic growth provides a glimmer of hope. Like other models of economic growth, such as the Malthusian model, the Solow growth model relies on a production function and a tendency towards a steady state point. A diagram of the Solow model is identical to a diagram of the Malthusian model, but with different axes: rather than labor on the horizontal axis and output/income on the vertical axis, the Solow model has capital per worker on the horizontal axis and savings/investment per worker on the vertical axis. And instead of a subsistence line, we have a balanced growth investment per worker line. Production remains a function of labor, capital, and technology, and still has diminishing marginal returns. (A few adjustments are needed to express the production function in per worker terms and to derive a savings/investment function from the production function, but the analysis remains essentially unchanged).
In this model, capital is key. The growth of the economy is determined by the growth of capital. At the steady state point, capital per worker is constant at the "balanced" level. At this level, the growth of capital is keeping up with depreciation and the growth in population. If we are to the left of the steady state point, the growth of capital is outpacing depreciation and the growth in population; therefore, capital per worker must be increasing (capital deepening). Capital is an input to production, so production per worker is increasing, and therefore saving is also increasing. So, we move along the savings function to the right. If we are to the right of the steady state point, the growth of capital is not keeping pace with depreciation and the growth in population, so capital per worker must be decreasing. Output per worker is decreasing, so saving is also decreasing, and we move along the savings function to the left. The economy tends towards the steady state, where saving is just enough to keep capital per worker constant.

What does this mean for Memphis? Among economies with the same production functions and the same access to technology, the model predicts convergence: poor economies should grow more quickly and catch up to wealthy economies. Workers in poor economies have less income and save less; because saving determines the growth of capital, capital per worker is lower. But because of diminishing marginal returns, the rate of return on capital is higher for the poor economy. Although workers in the poor economy save less, the higher return on capital means production/income per worker is growing faster. Faster growth in income means faster growth in saving, which means faster growth in capital per worker. Capital per worker will increase in the poor economy relative to the rich economy, until they are both at the same steady state point with the same income per capita.
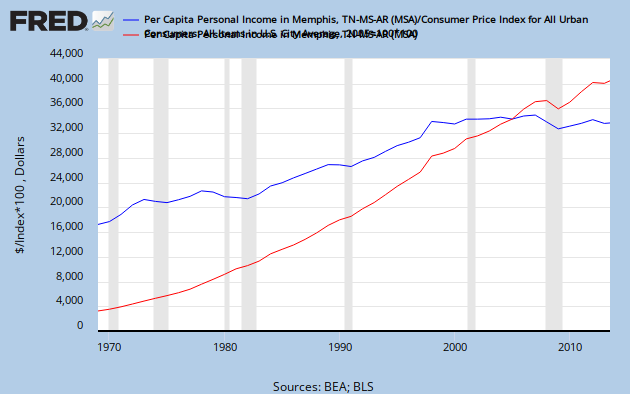
It's reasonable to argue that cities in the United States have the same production function and access to technology, so we should expect convergence. If convergence were occurring, the cities (metropolitan statistical areas, or MSAs) with the highest income initially would grow more slowly than the cities with the lowest income initially. Lo, and behold! This is the case:

As of the last Census, Memphis was the poorest large metropolitan area in the county. With Memphis' level of poverty, it will take more than a rising economic tide to lift the fortunes of the Bluff City; we need economic global warming with a subsequent rise in sea levels fueled by melting economic glaciers.
Tides are cyclical, but melting glaciers are a long run trend. And despite not experiencing the uptempo growth of similar sized cities like Austin and Nashville (maybe Memphis put its eggs in the wrong musical basket), Memphis' long run trend is lumpy but positive. But can we say anything more optimistic?
One theory of economic growth provides a glimmer of hope. Like other models of economic growth, such as the Malthusian model, the Solow growth model relies on a production function and a tendency towards a steady state point. A diagram of the Solow model is identical to a diagram of the Malthusian model, but with different axes: rather than labor on the horizontal axis and output/income on the vertical axis, the Solow model has capital per worker on the horizontal axis and savings/investment per worker on the vertical axis. And instead of a subsistence line, we have a balanced growth investment per worker line. Production remains a function of labor, capital, and technology, and still has diminishing marginal returns. (A few adjustments are needed to express the production function in per worker terms and to derive a savings/investment function from the production function, but the analysis remains essentially unchanged).
In this model, capital is key. The growth of the economy is determined by the growth of capital. At the steady state point, capital per worker is constant at the "balanced" level. At this level, the growth of capital is keeping up with depreciation and the growth in population. If we are to the left of the steady state point, the growth of capital is outpacing depreciation and the growth in population; therefore, capital per worker must be increasing (capital deepening). Capital is an input to production, so production per worker is increasing, and therefore saving is also increasing. So, we move along the savings function to the right. If we are to the right of the steady state point, the growth of capital is not keeping pace with depreciation and the growth in population, so capital per worker must be decreasing. Output per worker is decreasing, so saving is also decreasing, and we move along the savings function to the left. The economy tends towards the steady state, where saving is just enough to keep capital per worker constant.
It's reasonable to argue that cities in the United States have the same production function and access to technology, so we should expect convergence. If convergence were occurring, the cities (metropolitan statistical areas, or MSAs) with the highest income initially would grow more slowly than the cities with the lowest income initially. Lo, and behold! This is the case:
In fact, Memphis has outperformed the trend since 1969, growing slightly more quickly than its initial income would suggest.
The business cycle tides have not been favorable to Memphis, but if we bide our time, we may yet float to the top.
Monday, August 26, 2013
In a Jam
A traffic paradox: building more roads doesn't reduce congestion.
In Memphis, the road to riches is constanly under construction. Recently completed or ongoing projects include a multi-year, $4.5 million widening of Poplar in Germantown, a $3.9 million widening of Germantown Road, and a much anticipated segment of Wolf River Boulevard between Farmington and Kimbrough. Will these roads lead Memphis to a headache-free rush hour? Maybe not. A simple economic model leads to a surprising conclusion: building new capacity may not reduce congestion at all.
The key to the paradox lies in the idea of latent demand: Memphians try to avoid roads that will be congested. If congestion is severe enough, many commuters will switch to a different route or even resort to carpooling. So for every vehicle on a congested road, there are other vehicles that would like to use the road but have avoided it. When congestion is reduced by increased capacity, many commuters switch back to the formerly congested road, offsetting the reduction in congestion. In other words, capacity generates its own demand rather than just increasing space for the current drivers on the road.
Another force driving the paradox is the self-interest of drivers. There is a certainly a personal cost to driving on Germantown Parkway during rush hour: you sit bored in traffic listening to the same three songs on the radio and lose time. But there is also a social cost: you add one more vehicle to the congestion, and cause other drivers to sit bored in traffic listening to the same three songs on the radio and lose time. Drivers base their decisions on their personal cost while ignoring the social cost.
The combination of these two forces results in the Pigou-Knight-Downs Paradox (side note: a more apt model for the Wolf River connection is Braess' Paradox).

If the capacity of Poplar, C_P, is at least 10,000, twice the total number of drivers in our model (5,000), then there is no paradox. Poplar is always the quickest route, and no one will take Wolf River. But Poplar doesn't have this capacity. Suppose Poplar's capacity is less than 10,000. Then the drivers will choose the quickest route, which will change depending on the number of drivers that choose each route. The result will be that both routes will always take 30 minutes. Wolf River takes 30 minutes regardless of traffic, so if Poplar will take more than 30 minutes, commuters will switch to Wolf River until traffic on Poplar has fallen to the point where both routes take 30 minutes. If Poplar will take 25 minutes, drivers will switch from Wolf River to Poplar until both routes take 30 minutes.
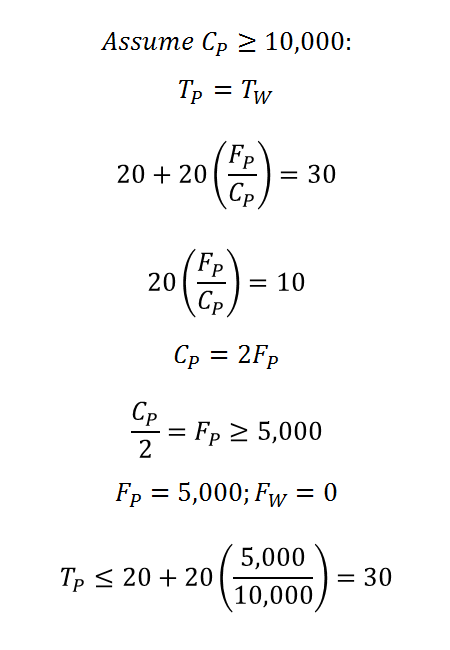
Given that drivers will change their behavior to equalize the travel time on the two routes, what happens when we widen Poplar? Assume that Poplar currently has just enough capacity to carry all 5,000 commuters, but traffic will be tight. If all 5,000 take Poplar, the drive will take 40 minutes. But if drivers choose the shortest route, 2,500 will take Poplar and 2,500 Wolf River. Both routes will take 30 minutes. Suppose a widening project increases the capacity of Poplar to 7,000. Here's the paradox: Poplar will still take 30 minutes! If drivers choose the quickest route, 3,500 will take Poplar and 1,500 will take Wolf River. Capacity generates demand. Only if Poplar's capacity is more than doubled to over 10,000 will travel time on Poplar decrease.

Can increases in capacity reduce congestion? When drivers minimize only private cost (their own driving time), capacity does not reduce congestion. If by law or agreement, the drivers acted to minimize total social cost (the sum of the time it takes everyone to get to their destination), extra capacity does reduce congestion.
Our model suggests that there are more efficient ways to deal with congestion, such as congestion pricing that forces drivers to pay for the negative externalities they generate.
Is road work wasting taxpayer dollars? Our model has some problems: the two routes don't lead to exactly the same place, for instance, and travel time on Wolf River wouldn't remain constant at all levels of traffic. Therefore, it's best to take these results with a grain of salt. But regardless of any model predictions, the distance from Cameron Brown Park to Taco Bell will be cut roughly in half. So I say it's money well spent.
In Memphis, the road to riches is constanly under construction. Recently completed or ongoing projects include a multi-year, $4.5 million widening of Poplar in Germantown, a $3.9 million widening of Germantown Road, and a much anticipated segment of Wolf River Boulevard between Farmington and Kimbrough. Will these roads lead Memphis to a headache-free rush hour? Maybe not. A simple economic model leads to a surprising conclusion: building new capacity may not reduce congestion at all.
The key to the paradox lies in the idea of latent demand: Memphians try to avoid roads that will be congested. If congestion is severe enough, many commuters will switch to a different route or even resort to carpooling. So for every vehicle on a congested road, there are other vehicles that would like to use the road but have avoided it. When congestion is reduced by increased capacity, many commuters switch back to the formerly congested road, offsetting the reduction in congestion. In other words, capacity generates its own demand rather than just increasing space for the current drivers on the road.
Another force driving the paradox is the self-interest of drivers. There is a certainly a personal cost to driving on Germantown Parkway during rush hour: you sit bored in traffic listening to the same three songs on the radio and lose time. But there is also a social cost: you add one more vehicle to the congestion, and cause other drivers to sit bored in traffic listening to the same three songs on the radio and lose time. Drivers base their decisions on their personal cost while ignoring the social cost.
The combination of these two forces results in the Pigou-Knight-Downs Paradox (side note: a more apt model for the Wolf River connection is Braess' Paradox).
To illustrate the paradox, let's simplify the city. Imagine 5,000 workers in Memphis have only two routes home to Germantown or Collierville: Poplar, or Walnut Grove and Wolf River. Assume Poplar is the more direct route, but is narrower and more congested than the less direct but wider Wolf River route. Suppose Poplar takes 20 minutes when there's no traffic but the time it takes rises linearly with the level of congestion (the ratio of the flow of traffic to capacity). Suppose Walnut Grove and Wolf River takes 30 minutes, regardless of traffic. Some notation: define full capacity as the flow of traffic at which the speed falls to half the speed with no traffic. Call the traffic flow on Poplar F_P and the traffic flow on the Wolf River route F_W. Call the capacity of Poplar C_P. Finally, let the time it takes to travel home on Poplar be T_P and the time it takes to travel home on Wolf River T_W.
If the capacity of Poplar, C_P, is at least 10,000, twice the total number of drivers in our model (5,000), then there is no paradox. Poplar is always the quickest route, and no one will take Wolf River. But Poplar doesn't have this capacity. Suppose Poplar's capacity is less than 10,000. Then the drivers will choose the quickest route, which will change depending on the number of drivers that choose each route. The result will be that both routes will always take 30 minutes. Wolf River takes 30 minutes regardless of traffic, so if Poplar will take more than 30 minutes, commuters will switch to Wolf River until traffic on Poplar has fallen to the point where both routes take 30 minutes. If Poplar will take 25 minutes, drivers will switch from Wolf River to Poplar until both routes take 30 minutes.
Given that drivers will change their behavior to equalize the travel time on the two routes, what happens when we widen Poplar? Assume that Poplar currently has just enough capacity to carry all 5,000 commuters, but traffic will be tight. If all 5,000 take Poplar, the drive will take 40 minutes. But if drivers choose the shortest route, 2,500 will take Poplar and 2,500 Wolf River. Both routes will take 30 minutes. Suppose a widening project increases the capacity of Poplar to 7,000. Here's the paradox: Poplar will still take 30 minutes! If drivers choose the quickest route, 3,500 will take Poplar and 1,500 will take Wolf River. Capacity generates demand. Only if Poplar's capacity is more than doubled to over 10,000 will travel time on Poplar decrease.
Can increases in capacity reduce congestion? When drivers minimize only private cost (their own driving time), capacity does not reduce congestion. If by law or agreement, the drivers acted to minimize total social cost (the sum of the time it takes everyone to get to their destination), extra capacity does reduce congestion.
Our model suggests that there are more efficient ways to deal with congestion, such as congestion pricing that forces drivers to pay for the negative externalities they generate.
Is road work wasting taxpayer dollars? Our model has some problems: the two routes don't lead to exactly the same place, for instance, and travel time on Wolf River wouldn't remain constant at all levels of traffic. Therefore, it's best to take these results with a grain of salt. But regardless of any model predictions, the distance from Cameron Brown Park to Taco Bell will be cut roughly in half. So I say it's money well spent.
Friday, August 23, 2013
Walking in Memphis
Memphians don't like to walk. What does this mean for Beale Street Landing?
Memphis is not a city that likes to move. Combine oppressive summer heat with world famous barbecue and a population of which only half report exercising frequently, and the result is not surprising: Memphis is a plump place. In fact, it was the fattest city in the nation in 2012.
Memphis is a city that likes to invest large sums of public money into pie-in-the-sky projects. After years of delays and budget overruns, Beale Street Landing is finally nearing completion. But a crucial piece of the Beale Street Landing puzzle is still missing. The Riverfront Development Corporation planned to anchor the project with a restaurant, but to the frustration of all, a restaurant tenant has yet to be found.
So what does Memphis' lethargy have to do with Beale Street Landing?
Consider that parking issues ensure that most downtown patrons will be on foot. Consider also that Memphis' hot summers and large stomachs mean that there is a real cost to walking, a cost paid with sore feet and a sweaty brow. Now add the fact that Beale Street Landing is several blocks away from any other restaurants or bars, and the result is a lack of incentive for a restaurant to move in.
We can illustrate the situation with a simple game theory location model. But before we can apply the model, we need to make some simplifications. Imagine Beale Street as a one dimensional strip with one end, 0, at Riverside Drive and the other end, 1, at Danny Thomas Boulevard. Assume customers are uniformly distributed along Beale Street (this is equivalent to saying that the point where customers enter Beale Street is random with each point just as likely as any other point). Assume also that each restaurant and bar on Beale Street sells identical meals and drinks and charges an identical price (we’ll relax this assumption later) and that consumers buy exactly 1 or 0 meals. Finally, assume that customers will go to the cheapest option, including the cost of walking, and that every customer can afford a meal.
No restaurant has committed to moving into Beale Street Landing yet, so let’s first consider the simplest case of a restaurant that can pick any location along Beale. If prices are identical, consumers will choose the closest place. Divide the bars and restaurants of Beale Street into two groups: the prospective Beale Street Landing restaurant (“B.S.L.”) and everything else (“Bars”). Beale Street Landing is at the very bottom of Beale, while the other bars and restaurants are about halfway between Riverside (0) and Danny Thomas (1). If the restaurant moves into Beale Street Landing, it will get one 1/4th of the customers on Beale, while the bars farther up will get 3/4ths.

A rational restaurateur will move in closer to the other restaurants. If the restaurant moves to the halfway point between Riverside (0) and the bars, it will get 1/4 + 1/8 = 3/8 of the customers, while the bars will get 1/2 + 1/8 = 5/8 of the customers. If the restaurant chooses an even closer location, it will further increase its share; to get the maximum share, it would choose a location immediately next to the bars at the halfway point between Riverside and Danny Thomas. Both will then get 1/2 of the customers. (Side note: this analysis treats all the “other” restaurants and bars as a single entity. If this single entity is also allowed to move, the equilibrium will still be at the halfway point. If we treat each bar as a separate entity, though, a stable equilibrium does not exist!)
Now let’s assume the restaurant is already committed to moving in to Beale Street Landing, but is free to set its own price. At this point, we need to formalize the full cost of each option, including the cost of walking. Let t be the physical toll of walking one unit of distance. Let d be the distance a consumer walks. Let’s make the cost of walking quadratic: each step is more painful than the last. The total transportation cost then is td^2. Suppose a customer enters Beale Street at random distance x from Riverside Drive. The cost of walking to Beale Street Landing and buying a meal is the price of a Beale Street Landing meal, P_BSL, plus the transportation cost, tx^2: P_BSL + tx^2. The cost of walking to the bars and buying a meal is P_Bars + t(1/2 – x)^2.

At what point will a customer face the same cost for both options? That would be where the cost of the meal plus walking is the same for each, the point x_i. If the prices are the same, then we get our initial result: the indifferent customer is at location 1/4, or halfway between the bars and Beale Street Landing. If Beale Street Landing lowers their price below the bars, they will attract customers from farther away as the lower price offsets some of the misery of walking. The indifferent customer would then be farther to the right on our [0, 1] diagram.

What does the Beale Street Landing restaurant need to do to maximize its profits given its distant location? To answer this, we need demand functions that tell us what share each would get given the two prices and the cost of walking. Distances on the [0,1] line can be thought of as shares of customers, so we generate demand functions by finding the point where the prices are equal; the consumers to the left of the equilibrium point go to B.S.L., while the consumers to the right go to the Bars. As expected, the demand functions show that if the prices are the same, Beale Street Landing will get 1/4th and the bars will get 3/4th. To optimize, we use the usual profit function given by the price times the quantity sold (in this case, demand) minus the cost of producing a meal (c) times the number of meals produced (also demand).

Maximising profit for each and solving the system of equations gives the optimal prices, P*_BSL and P*_Bars. Plug these prices into the demand functions to get shares: if Beale Street Landing sets its price optimally, the most it can get is 5/12 of the customers, while the bars will get 7/12. Comparing profits, Beale Street Landing will only make about half what the bars make. Of course, these numbers are a result of our stylized model and shouldn't be taken as exact predictions, but they illustrate the point.
So it’s not looking good for Beale Street Landing. Less mathematical versions of this same argument have members of the press calling the project a fiasco. Of course, our simple model doesn’t capture all the complexities of real life: (1) meals and drinks are not identical up and down Beale; (2) a solution may come along that improves access, like bikes or more parking; (3) people may be willing to pay a premium, both in terms of price and walking costs, for the novelty of eating at a restaurant on the riverfront. And with the new Greenline and Greenway expansions, maybe Memphians are finally warming up to the idea of walking.
But for now, this simple model predicts that the RDC will have a hard time finding a restaurant to move in to Beale Street Landing. So far, the predictions match reality.
Memphis is not a city that likes to move. Combine oppressive summer heat with world famous barbecue and a population of which only half report exercising frequently, and the result is not surprising: Memphis is a plump place. In fact, it was the fattest city in the nation in 2012.
Memphis is a city that likes to invest large sums of public money into pie-in-the-sky projects. After years of delays and budget overruns, Beale Street Landing is finally nearing completion. But a crucial piece of the Beale Street Landing puzzle is still missing. The Riverfront Development Corporation planned to anchor the project with a restaurant, but to the frustration of all, a restaurant tenant has yet to be found.
So what does Memphis' lethargy have to do with Beale Street Landing?
Consider that parking issues ensure that most downtown patrons will be on foot. Consider also that Memphis' hot summers and large stomachs mean that there is a real cost to walking, a cost paid with sore feet and a sweaty brow. Now add the fact that Beale Street Landing is several blocks away from any other restaurants or bars, and the result is a lack of incentive for a restaurant to move in.
We can illustrate the situation with a simple game theory location model. But before we can apply the model, we need to make some simplifications. Imagine Beale Street as a one dimensional strip with one end, 0, at Riverside Drive and the other end, 1, at Danny Thomas Boulevard. Assume customers are uniformly distributed along Beale Street (this is equivalent to saying that the point where customers enter Beale Street is random with each point just as likely as any other point). Assume also that each restaurant and bar on Beale Street sells identical meals and drinks and charges an identical price (we’ll relax this assumption later) and that consumers buy exactly 1 or 0 meals. Finally, assume that customers will go to the cheapest option, including the cost of walking, and that every customer can afford a meal.
No restaurant has committed to moving into Beale Street Landing yet, so let’s first consider the simplest case of a restaurant that can pick any location along Beale. If prices are identical, consumers will choose the closest place. Divide the bars and restaurants of Beale Street into two groups: the prospective Beale Street Landing restaurant (“B.S.L.”) and everything else (“Bars”). Beale Street Landing is at the very bottom of Beale, while the other bars and restaurants are about halfway between Riverside (0) and Danny Thomas (1). If the restaurant moves into Beale Street Landing, it will get one 1/4th of the customers on Beale, while the bars farther up will get 3/4ths.
Now let’s assume the restaurant is already committed to moving in to Beale Street Landing, but is free to set its own price. At this point, we need to formalize the full cost of each option, including the cost of walking. Let t be the physical toll of walking one unit of distance. Let d be the distance a consumer walks. Let’s make the cost of walking quadratic: each step is more painful than the last. The total transportation cost then is td^2. Suppose a customer enters Beale Street at random distance x from Riverside Drive. The cost of walking to Beale Street Landing and buying a meal is the price of a Beale Street Landing meal, P_BSL, plus the transportation cost, tx^2: P_BSL + tx^2. The cost of walking to the bars and buying a meal is P_Bars + t(1/2 – x)^2.
So it’s not looking good for Beale Street Landing. Less mathematical versions of this same argument have members of the press calling the project a fiasco. Of course, our simple model doesn’t capture all the complexities of real life: (1) meals and drinks are not identical up and down Beale; (2) a solution may come along that improves access, like bikes or more parking; (3) people may be willing to pay a premium, both in terms of price and walking costs, for the novelty of eating at a restaurant on the riverfront. And with the new Greenline and Greenway expansions, maybe Memphians are finally warming up to the idea of walking.
But for now, this simple model predicts that the RDC will have a hard time finding a restaurant to move in to Beale Street Landing. So far, the predictions match reality.
Wednesday, August 21, 2013
Malthusian Memphis?
Other mid-sized cities are flourishing. Is Memphis stuck?
It’s the year of the mid-sized city, but Memphis seems to have missed the boat. Austin, Raleigh, Charlotte, and Oklahoma City, to name a few, are turning heads with their rapid growth. Nashville, Memphis' Elvis-stealing neighbor, is America’s new “it” city.
Even Des Moines is getting attention. Des Moines. “When you come from Des Moines you either accept the fact without question and settle down with a girl called Bobbie and get a job in the Firestone factory and live there forever and ever or you spend your adolescence moaning at length about what a dump it is and how you can't wait to get out and then you settle down with a local girl named Bobbie and get a job in the Firestone factory and live there forever and ever.” (Bill Bryson) Despite all of this, an alarming number of people are using words like “thriving” in the same sentence as “Des Moines."
Surely no Memphian, proud or otherwise, is content to watch Des Moines pass us by.


Memphis may not be enjoying the growth and prosperity of Nashville or Austin (or even boring Des Moines), but it’s fairly safe to say that we’ve avoided the Malthusian stagnation that characterized medieval Europe. So that’s something. Let’s give ourselves a pat on the back.
It’s the year of the mid-sized city, but Memphis seems to have missed the boat. Austin, Raleigh, Charlotte, and Oklahoma City, to name a few, are turning heads with their rapid growth. Nashville, Memphis' Elvis-stealing neighbor, is America’s new “it” city.
Even Des Moines is getting attention. Des Moines. “When you come from Des Moines you either accept the fact without question and settle down with a girl called Bobbie and get a job in the Firestone factory and live there forever and ever or you spend your adolescence moaning at length about what a dump it is and how you can't wait to get out and then you settle down with a local girl named Bobbie and get a job in the Firestone factory and live there forever and ever.” (Bill Bryson) Despite all of this, an alarming number of people are using words like “thriving” in the same sentence as “Des Moines."
Surely no Memphian, proud or otherwise, is content to watch Des Moines pass us by.
Memphis hasn't experienced anything near the income or
population growth of its similar sized sister cities. Why is Memphis missing
out on all the fun? Could Memphis be suffering from Malthusian stagnation?
In the grim Malthusian model of long run economic growth,
fertility and mortality steal away any increases in income and leave just
enough resources to sustain life. The model has two building blocks: the subsistence
line and the production function.
The subsistence line shows the amount of output/income, Y,
needed to sustain a given number of people, N. Let’s make everyone work in this
model, so “people”, “workers”, and “employment” are interchangeable. Income per
worker (Y/N) is constant along the subsistence line. Above the line, income per
worker is greater than required for survival; people have enough to eat and
then some. We can support more children, so why not? Birth rates increase.
Everyone is well fed, so death rates decrease. Both factors cause population to
grow. But below the line, life isn't as rosy. Income per worker is below the amount
needed to survive. None of us can afford another hungry mouth to feed. Birth
rates fall. Everyone is struggling to feed themselves, so starvation and
disease lead to an increase in death rates. Both factors cause population to
shrink. Population growth in the bountiful years will steal away our surplus
until we all have just enough to survive, and population decline during the
occasional potato famine will ensure the lucky ones will have just enough to
survive.
The second building block, the production function, shows the amount of output/income (Y) that the economy can generate with a given number of workers (holding other factors fixed). The crucial feature of the production function is diminishing marginal product of labor: if a farm with one employee hires a second, production will increase by a greater amount than if that same farm had one thousand employees and hired one more. So the production function flattens out as employment increases.
The second building block, the production function, shows the amount of output/income (Y) that the economy can generate with a given number of workers (holding other factors fixed). The crucial feature of the production function is diminishing marginal product of labor: if a farm with one employee hires a second, production will increase by a greater amount than if that same farm had one thousand employees and hired one more. So the production function flattens out as employment increases.
The combination of the subsistence line and the production
function paints a pessimistic picture. Suppose the economy starts at a point to
the left of the subsistence line. Resources are abundant; each worker has more
than he needs to survive. The surplus encourages population growth and
therefore more workers. The additional workers generate additional output, but
diminishing marginal returns to labor means each one adds less than the one
before. So the economy moves along the production function towards the
subsistence line until everyone has just enough to survive (the production
function determines how much output a given number of workers can generate, so
it is along this curve that the economy moves). Now suppose the economy is at a
point on the production function to the right of the subsistence line.
Resources are scarce and the population decreases, which decreases production.
But because of diminishing marginal returns, the decreases in production will
be of lesser magnitude than the decreases in population as we move left along
the curve. Income per worker will rise until everyone has just enough to
survive. The economy will settle on the steady state point no matter where it
starts. In the steady state, income per person doesn't grow. Population doesn’t
grow. There is no economic growth.
But it gets worse. Imagine a new technology is invented or imported that makes every single Memphian more productive. The same number of workers can now produce more output, so the production curve pivots upwards. Surely this will generate economic growth and make us all better off? Alas. For the same reasons as above, the economy moves along the production function to the subsistence line. Total production increases. Population increases. But income per person returns to its depressing pre-invention level. We waste away in Malthusian stagnation.
But it gets worse. Imagine a new technology is invented or imported that makes every single Memphian more productive. The same number of workers can now produce more output, so the production curve pivots upwards. Surely this will generate economic growth and make us all better off? Alas. For the same reasons as above, the economy moves along the production function to the subsistence line. Total production increases. Population increases. But income per person returns to its depressing pre-invention level. We waste away in Malthusian stagnation.
Inescapable poverty with no income growth and no population growth. It does sound eerily familiar.
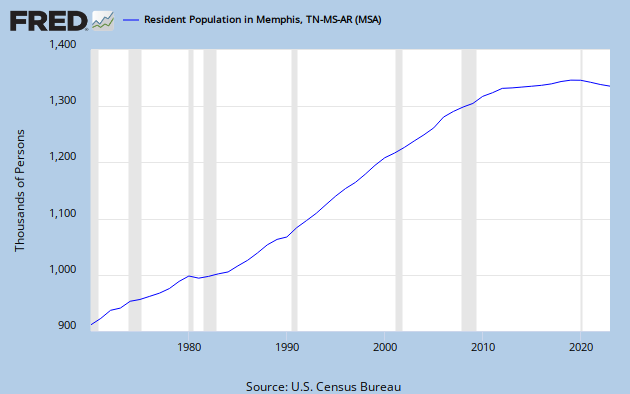
You can breathe a sigh of relief, though, because Memphis has clearly non-Malthusian properties. Although real income growth stalled during the recession, both real income per capita and population in Memphis have shown steady long-run growth trends, which isn’t allowed under Malthus. In fact, Malthusian stagnation doesn’t really characterize any existing economies. (It does, however, do a good job of describing the world from, say, the Neolithic revolution up until around 1800. So give Thomas some credit).
You can breathe a sigh of relief, though, because Memphis has clearly non-Malthusian properties. Although real income growth stalled during the recession, both real income per capita and population in Memphis have shown steady long-run growth trends, which isn’t allowed under Malthus. In fact, Malthusian stagnation doesn’t really characterize any existing economies. (It does, however, do a good job of describing the world from, say, the Neolithic revolution up until around 1800. So give Thomas some credit).
Memphis may not be enjoying the growth and prosperity of Nashville or Austin (or even boring Des Moines), but it’s fairly safe to say that we’ve avoided the Malthusian stagnation that characterized medieval Europe. So that’s something. Let’s give ourselves a pat on the back.
Subscribe to:
Posts (Atom)